

Siemens
CLIENT
SIEMENS PORTUGAL
ROLE
PRODUCT DESIGN • BRAND DESIGN
DELIVERABLES
WEB APP • BRAND IDENTITY
E.SENSE PREDICTIVE
MAINTENANCE


Siemens approached VMware Tanzu Labs to help them build an application that provides actionable insights for factory owners and managers who are interested in energy efficiency of their power plant and who need to take operational and investment decisions.
I worked as Lead UX/UI Designer and consultant on the project working alongside PMs, engineers and data-scientists both from Siemens and VMware.
We only had 11 weeks to build an MVP. For the long-term vision, Siemens also wanted a polished design with customisable functionalities so they had a motivational product offer for their clients.
01 CHALLENGE
Provide actionable insights for factory owners and managers

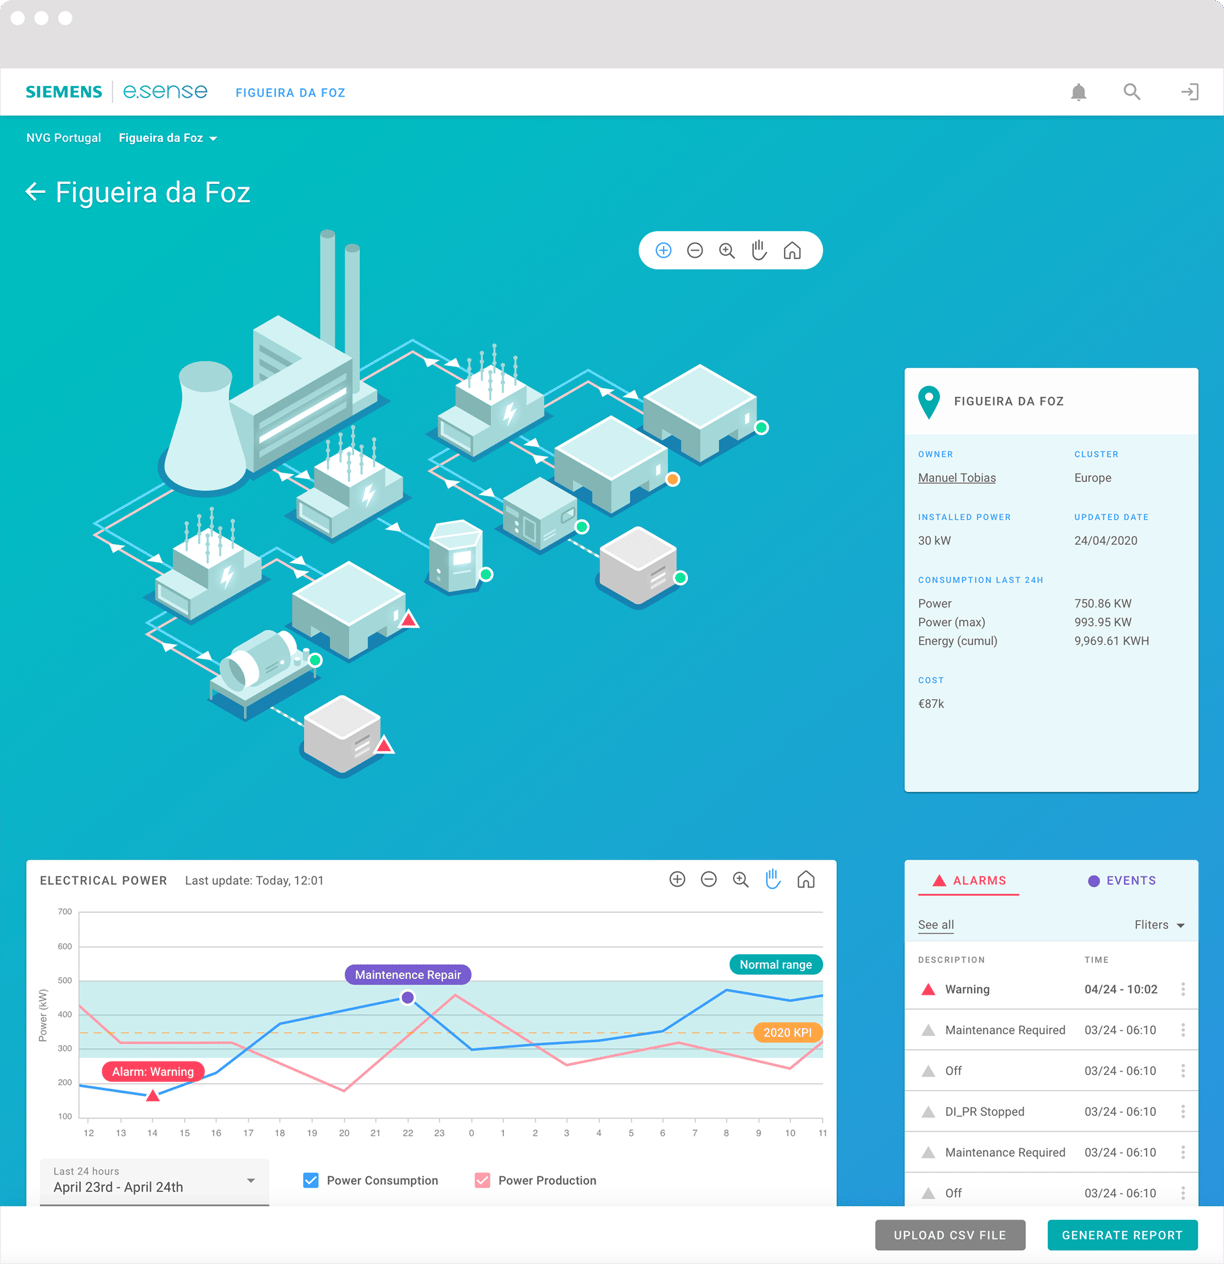
↑ Final design: the main view of a factory

As part of the project kickoff and together with the team, I created personas for the main users of the system in order to empathise with their needs and pain points.
We started with proto personas based on our assumptions and after each round of user research we incorporated our learnings and updated them.
We focused mainly on the Manuel persona as most of his needs would cover the others as well.
02 PERSONAS
Meet Manuel, Fred and Tobias
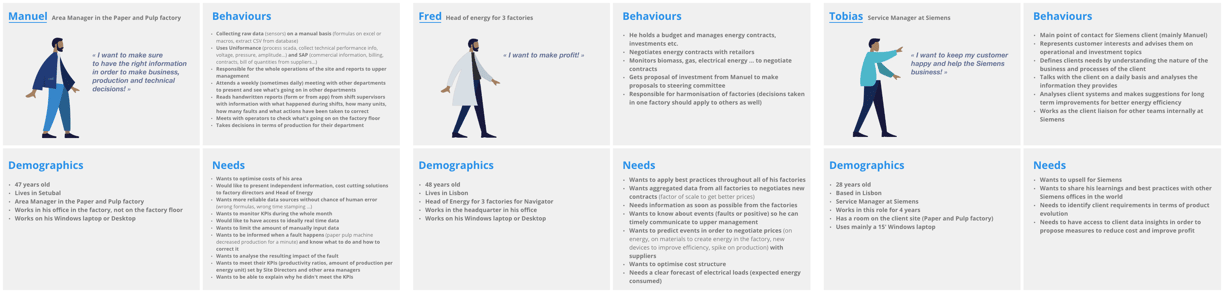
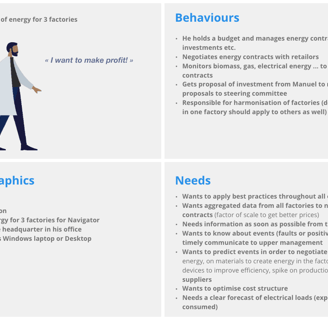
↑ Our personas, fictional characters which represent the target users
I facilitated a couple of remote sketching exercises with the whole team to generate many possible solutions for specific user scenarios.
By encouraging cross-disciplinary roles to think deeply about a problem simultaneously, we discover many more unknowns than if a designer sketched alone. Additionally, when developers are in the process they understand where the product is going and are able to make better decisions. It can save them time later as they're developing the product we create as a team.
03 DESIGN STUDIO
The power of collaborative sketching
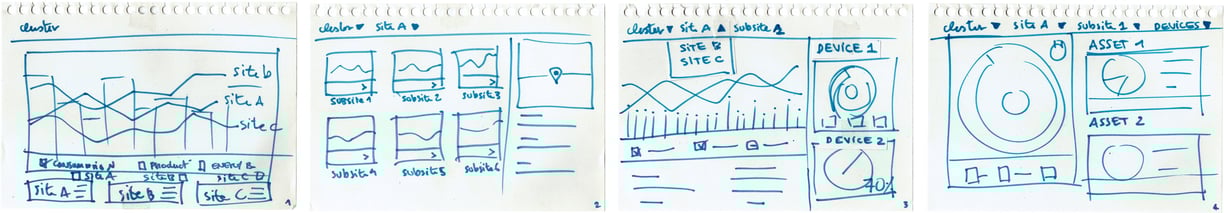
↑ Example created during a design studio showing how the factory manager visualizes the overall consumption of electricity of his factory

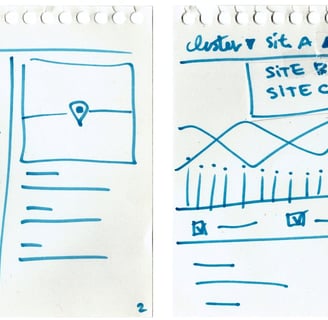
Taking the summary from the design studio session I then started wireframing a first prototype in order to test our main assumptions.
04 WIREFRAMING
Determine intended functionality in the interface
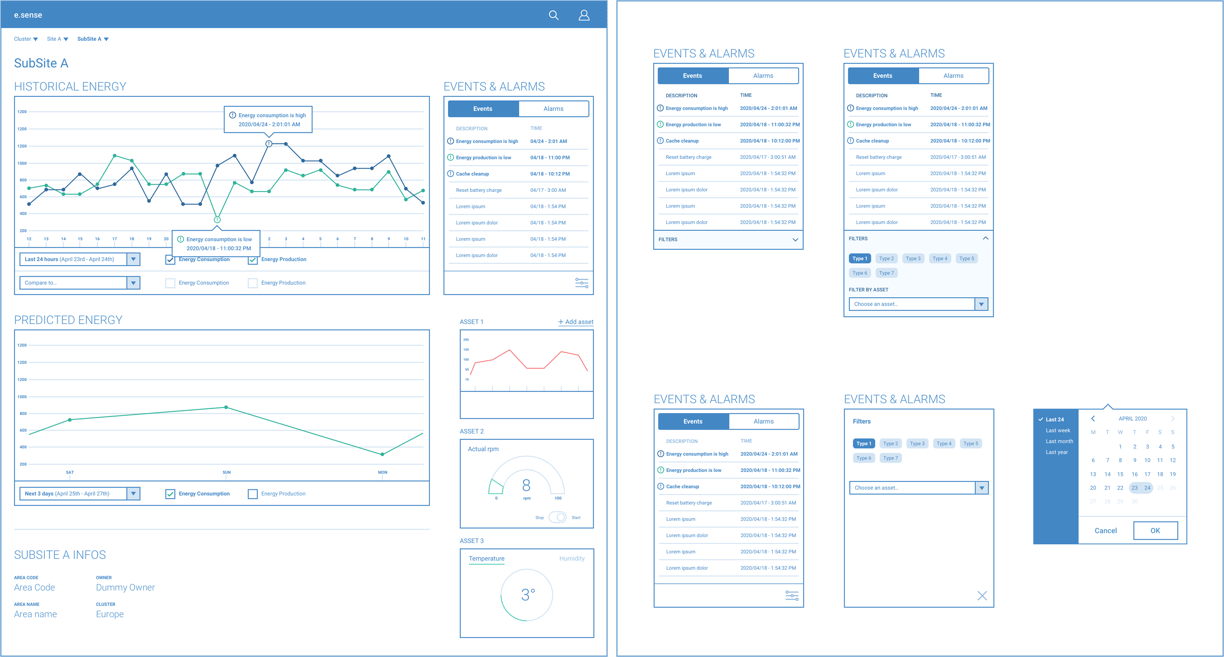
↑ Wireframe for initial prototype used during user interviews
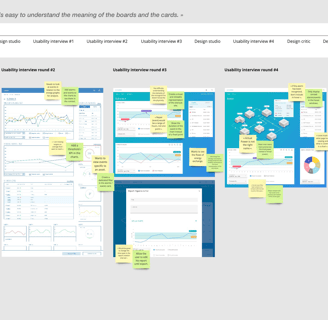
I conducted 5 rounds of 1:1 interviews with power plant managers to understand how they are monitoring energy flows in their power plant today and to test our click-prototypes.
After each round we have collected many insights and validated or invalidated our main assumptions.
The user research determined the most important data points to display in the tool and the key interactions needed for the MVP.
05 USER RESEARCH
Validating our biggest assumptions
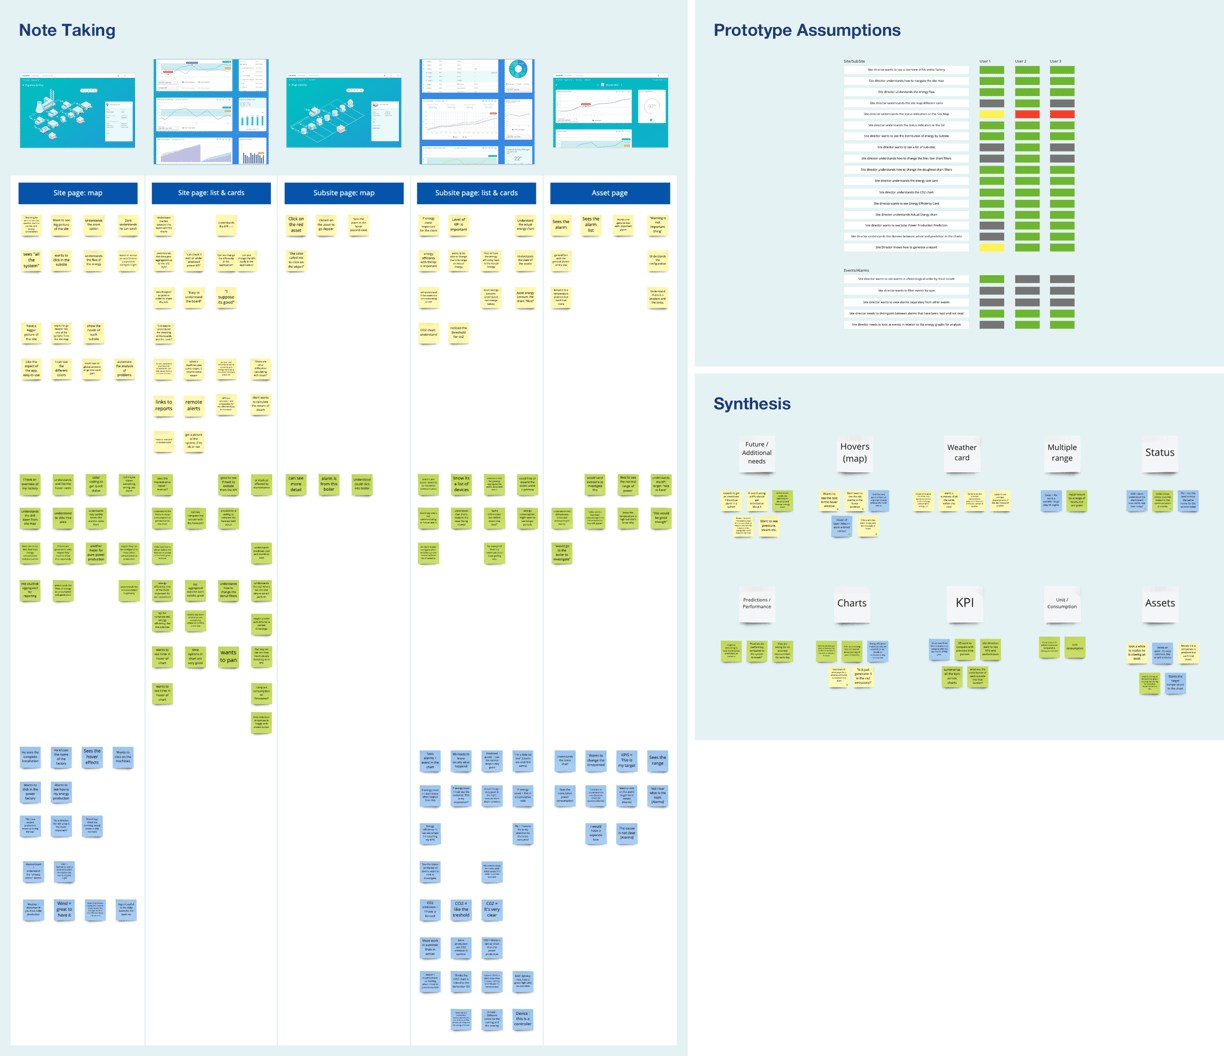

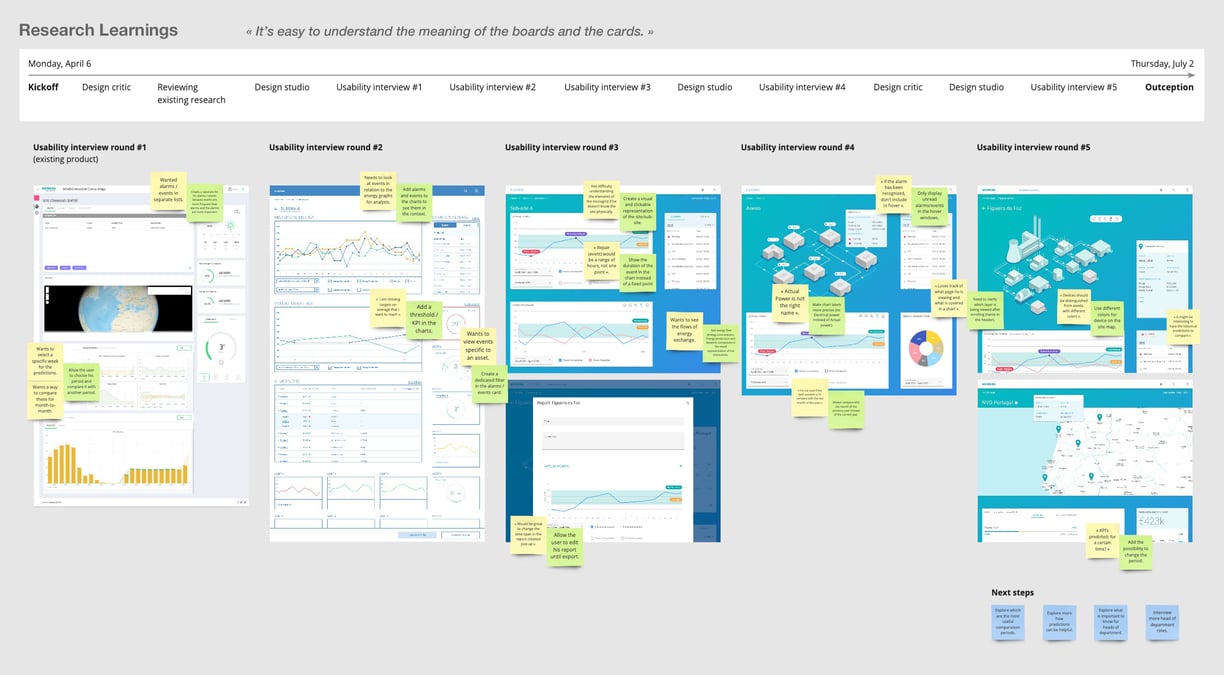
↑ Summary of the main user insights during the 11 weeks of the project with Siemens
↑ Boards used to capture user interview learnings
I like to hold regular design critiques with the team. It helps to find consensus when deciding what actions to take next and it holds the whole team accountable for making design decisions.
06 DESIGN CRITIQUE
Valuable design feedback from the project team
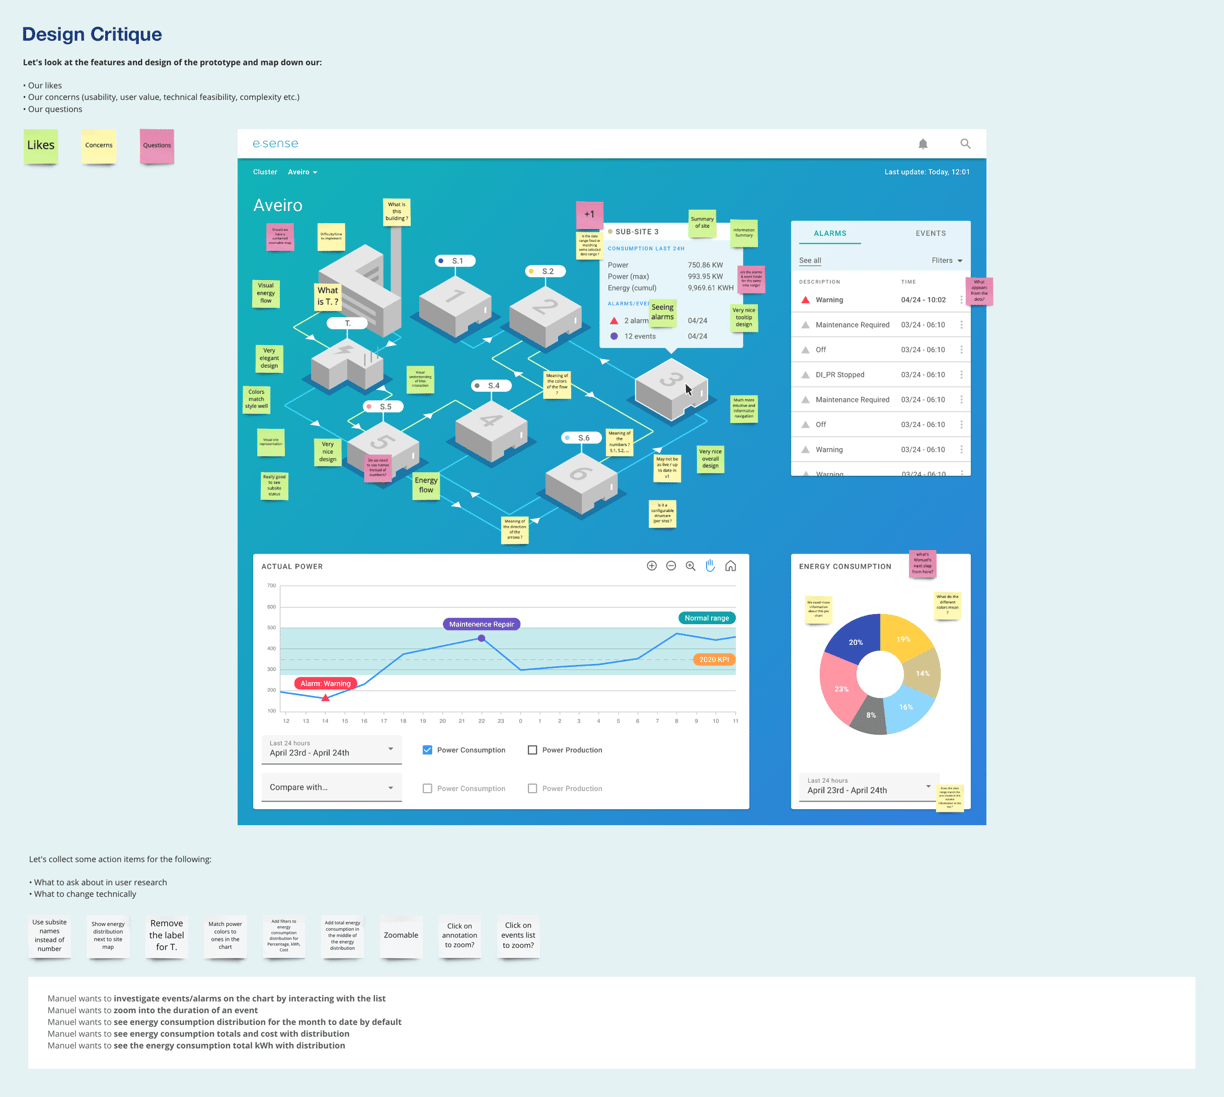
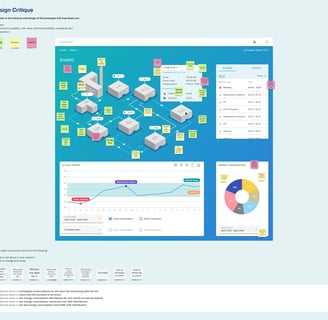
↑ A design critique session with action items
For the third round of user testing I started to develop a visual look & feel for the application. I worked on a colour scheme, UI components using Material Design and a logo for E.sense.
In addition to the planned features for the MVP, I also worked on a more long-term feature for a user need we heard in previous interviews: Factory owners would like to see a custom power plant view to see alarms and events in context and to make better decisions.
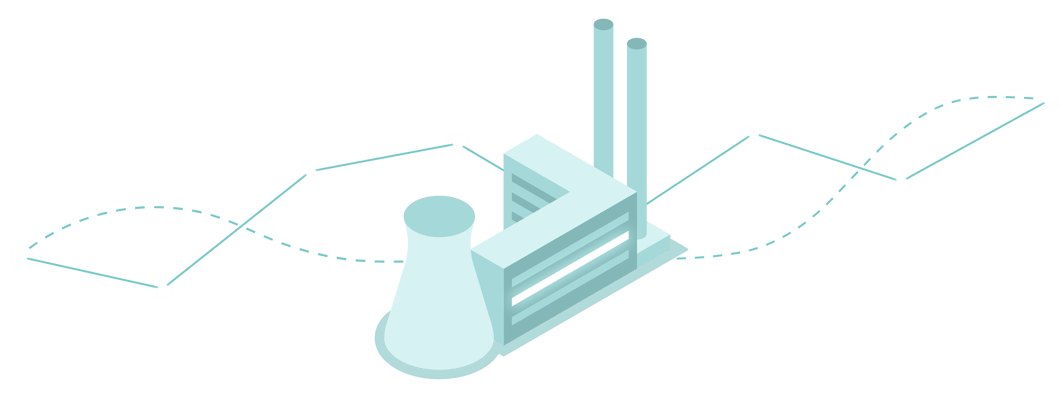
I used isometric illustrations to display the elements of the power plant in an interactive map that would be displayed on top of the graphs.
07 VISUAL DESIGN
Technical information does not have to look boring
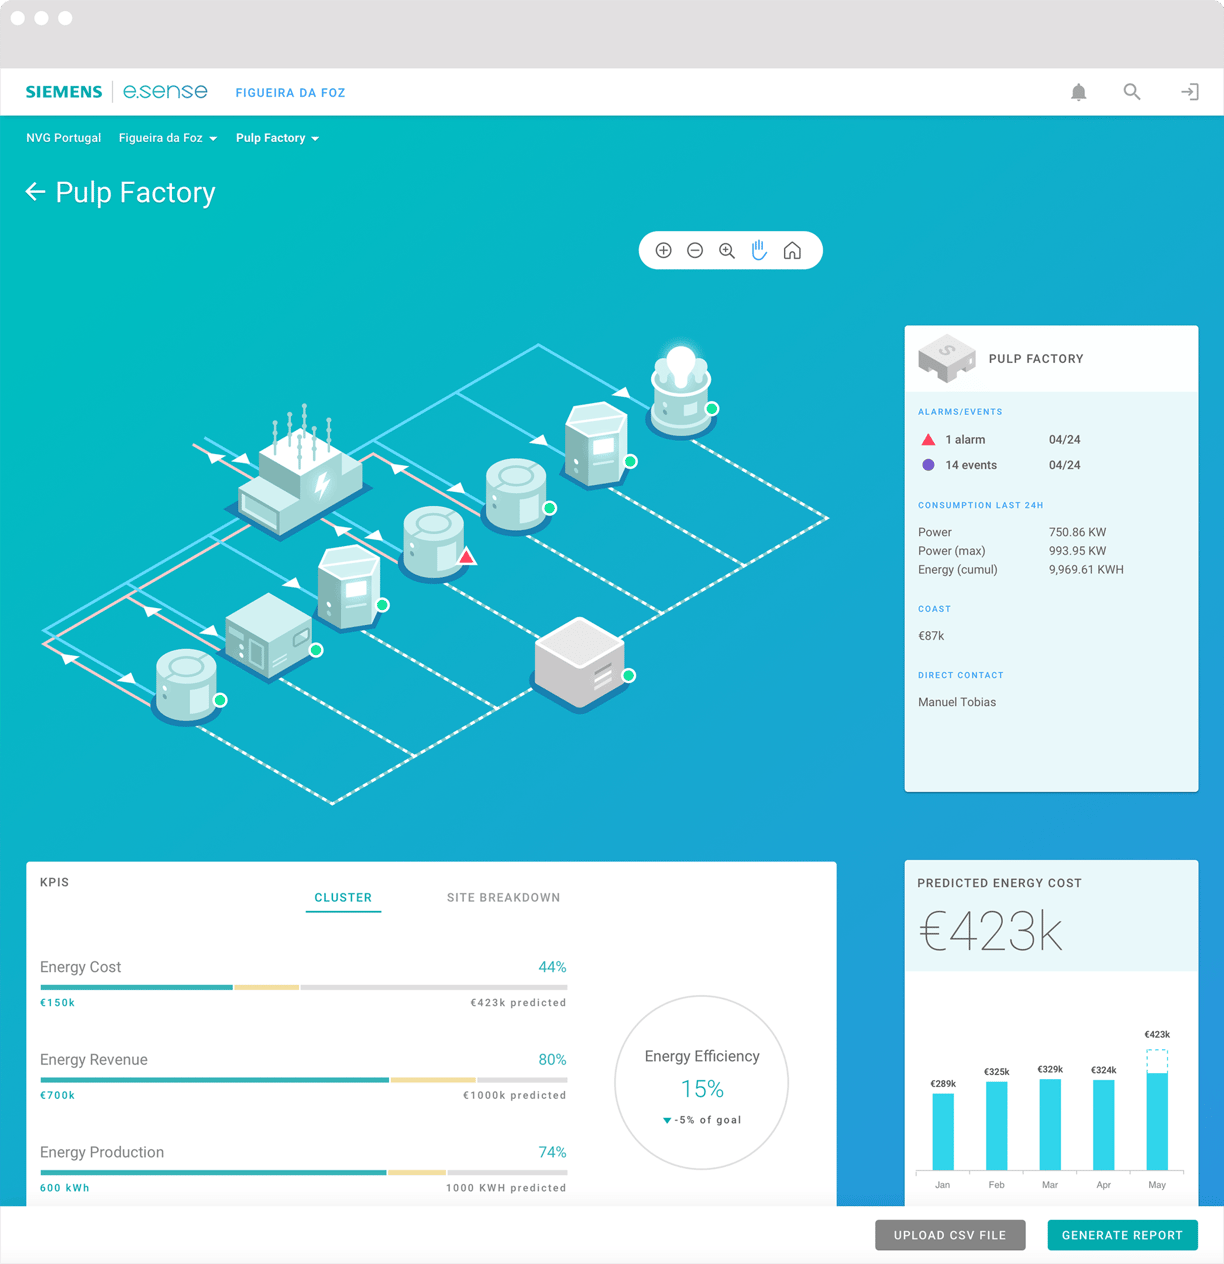
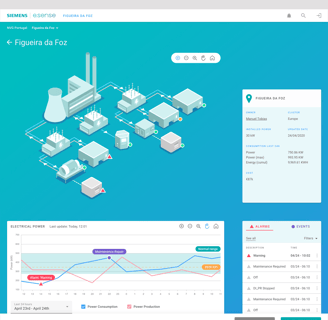
↑ Final design: the view of a subsite

© Thomas Gaudron 2024. All Rights Reserved.